Making the "invisible" nature of the water-energy relationship "visible"
The severity of the current drought in California compels an aggressive statewide effort to conserve water. In fact, the California Governor’s recently declared an unprecedented executive order (B-29-15) mandating a 25 percent statewide reduction in urban water use.
Meanwhile, a tremendous amount of energy is embedded within the water that Californians consume every day. Upwards of 20 percent of the electricity and 30 percent of the non-power-plant natural gas used in California goes to producing, moving, treating, and heating water.
Thus a response by water customers to significantly reduce their water consumption has important implications for statewide energy savings as well as greenhouse gas (GHG) emissions reductions. This relationship presents an important opportunity for water and energy utilities to design targeted regional programs that jointly conserve both water and energy. However, the development and deployment of these types of programs is hindered by limited visibility into these linked systems.
The Center for Water-Energy Efficiency (CWEE) at the University of California, Davis is working to make the “invisible” nature of the water-energy relationship “visible” by developing methodologies to improve data access, integration, and analysis across these two critical resource sectors.
Visualizing water-energy systems
Allocating energy efficiency and GHG reduction program dollars to water efficiency initiatives requires clear, defensible methods for calculating the energy intensity (EI) of water, and reliable, verifiable monitoring of energy and greenhouse gas (GHG) emissions savings achieved through water conservation. This is no small challenge because energy use varies significantly depending on where and when it’s used within the water infrastructure.
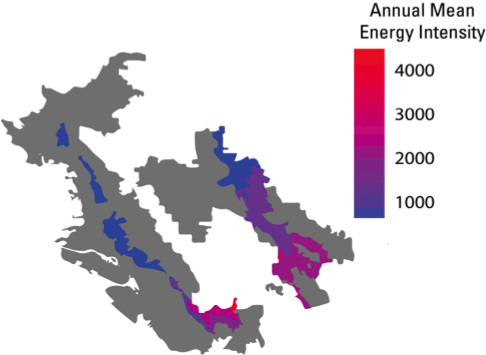
In our assessment of the East Bay Municipal Utility District (East Bay MUD) – a large California water agency that serves many of the large urban areas east of the San Francisco Bay – we found that the embedded energy in the water deliveries varied by roughly 12 percent seasonally and by more than 12X between delivery zones based on their spatial topography.


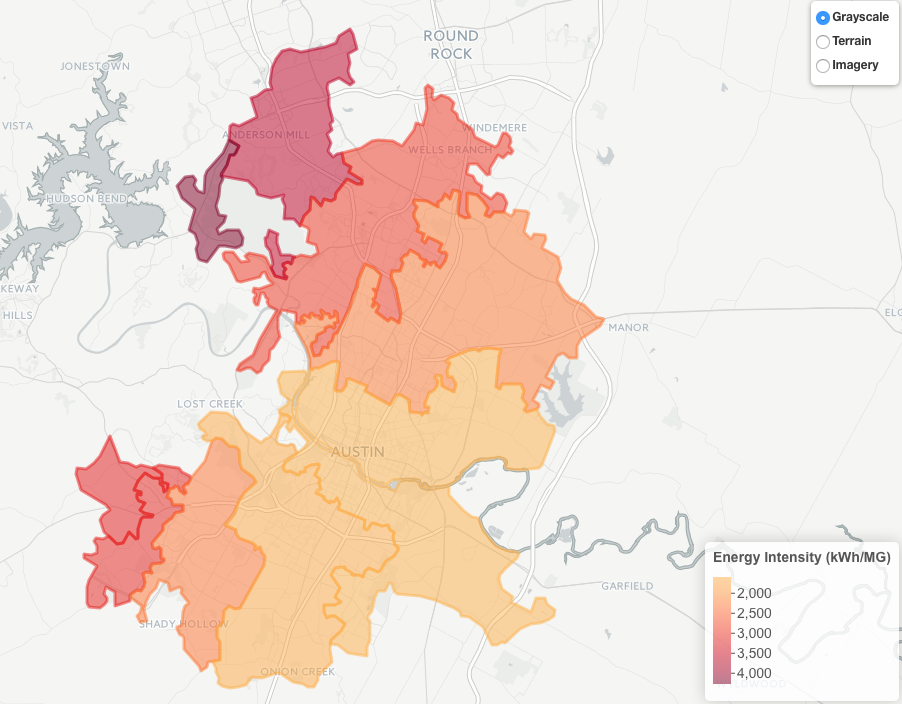
Since no two water agencies are the same, there is no “one-size-fits-all” EI number that can be given to a gallon of water. CWEE has formed partnerships with a number of water utilities to provide a detailed characterization of the energy-water relationship unique to their infrastructure systems. Our California water utility partners include the Los Angeles Department of Water and Power (LADWP), the Burbank Department of Water and Power, the San Diego County Water Authority (SDCWA), and the Otay Water District in California; and in Texas, we are working with the Austin Water utility.
Leveraging advanced IT solutions
Our portfolio of EI studies have been essential for advancing our understanding of energy use by water utilities in high-resolution. However, collecting, synthesizing, and managing the large data sets essential to these analyses requires a tremendous amount of effort. This presents a significant challenge to scaling out this approach more broadly across water utilities.
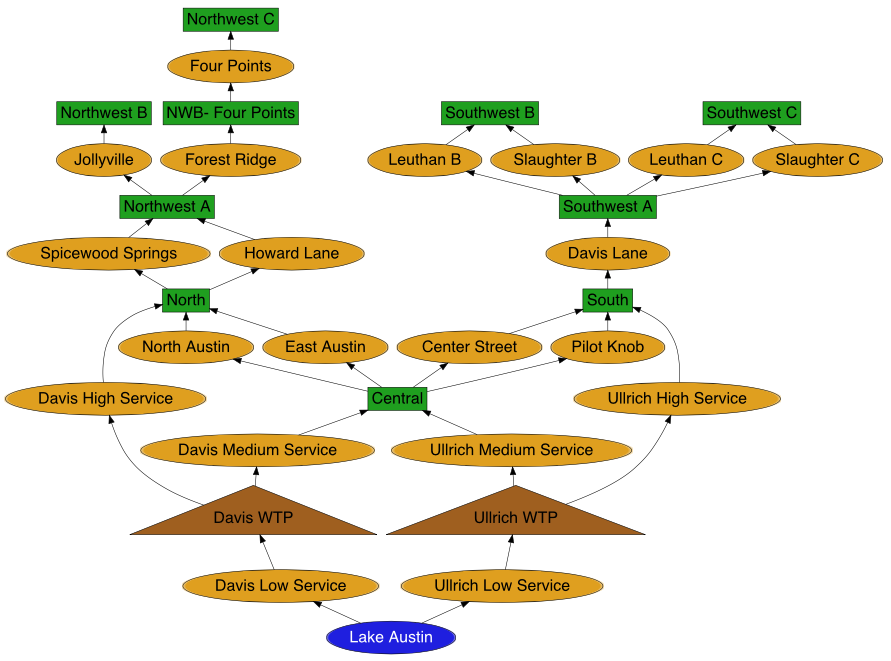
In response, CWEE has been investing significant effort into developing a streamlined computational architecture that flexibly draws data from utilities’ existing and emerging data streams, including: SCADA data, energy billing data, asset network schematics, and GIS data. This centralized data platform not only expedites the process of conducting an initial high-resolution EI analysis, it also hardwires the data and analytical capabilities required for ongoing monitoring and verification of savings from water-energy efficiency programs.


The pathway forward
With CWEE’s data-driven approach to characterizing water system EI, water utilities are better able to understand their baseline energy use, set realistic targets for both water and energy conservation, and monitor progress towards those goals. Developing a holistic computing platform offers great potential to streamline data capture, storage, and analytics, enabling ongoing system efficiency optimization. Further, the centralization of data allows for additional innovations, such as real-time water balancing (to identify system leaks), calculation of system-wide energy and cost savings from pump retrofits and replacements, and GHG reduction monitoring and reporting.
In our future research efforts, we aim to incorporate household water and energy consumption data into our analysis to link water use to estimate energy savings associated directly with water conservation by individual customer class. Further, the geographical specificity of the EI analysis, will allow the utility to target conservation efforts towards particularly energy intensive service areas.
This ability to target conservation efforts towards pressure zones with higher energy intensity has important implications for the cost-effectiveness of joint programs between water and energy utilities. With a disaggregated estimate of energy intensity, the project managers can invest in programs designed to jointly maximize water and energy resource savings, and thereby leverage a real (and often too rare) “win-win” opportunity for the utility partners.
Dr. Edward Spang is associated director of the Center for Water-Energy Efficiency at The University California, Davis. Dr. Spang’s research focuses on characterizing and optimizing the efficiency of linked water, energy, and food resource systems.
The views expressed by contributors to the Cynthia and George Mitchell Foundation's blogging initiative, "Achieving a Sustainable Texas," are those of the authors and do not necessarily represent the views of the foundation.

Hide Full Index
Show Full Index
View All Blog Posts